April 24, 2020
Were stock prices too high before Covid-19?
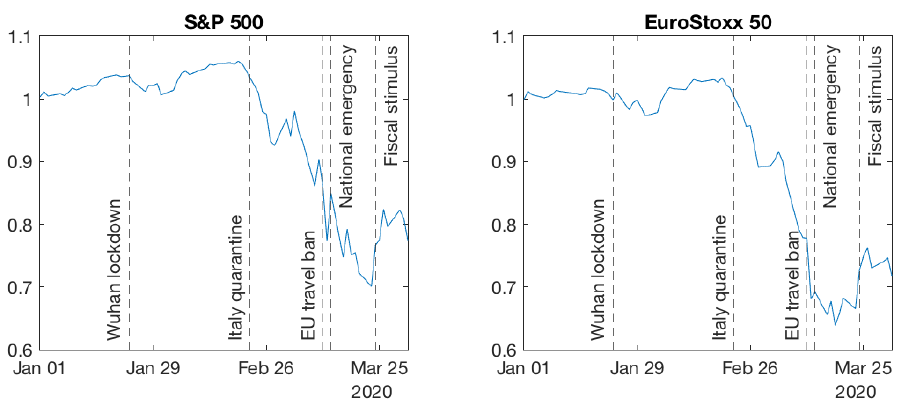
The arrival of Covid-19 in Europe made stock markets crash. The two graphs below show that the S&P 500 (the US stock market index) and the EuroStoxx 50 (the European index) went down by about 30% after Northern Italy was quarantined at the end of February. Minus 30% sounds like a large drop, but was it too large: did the market over-react? Alternatively, were stock prices too high before the crisis and the crash a correction to more reasonable stock prices?
In this post, we will use the tools learnt in Financial Markets to answer both questions, starting with the latter.
Today, let us study whether we can make sense of the level of stock prices before Covid. On the two graphs above, the S&P 500 and the EuroStoxx 50 are normalized such that they both start from a value of one on January 1st, 2020. We could have plotted the actual index levels (for instance, the S&P 500 was at 3258 on January 1st) but the absolute level of an index has no economic meaning. All that matters is the evolution of the index over time. That's why we can as well start from a value of one to make the numbers more readable as well as more easily comparable across markets.
If the level of the index is meaningless, which measure of stock prices is meaningful? An intuitive way to evaluate stock prices is to compare them to the profitability of listed companies and to dividends paid to shareholders. This intuition is at the root of the Dividend Discount Model that we studied in class. The DDM tells us that a stock is worth the present value of future dividends. When the growth rate of dividends is constant over time, the DDM boils down to
P = D/(k-g)
where
P = stock price
D = current dividend
k = discount rate (= expected stock returns)
g = growth rate of dividends
Intuitively, stocks are more valuable (P is higher) when dividends are higher today (D is large) and when dividends are expected to growth more in the future (g is large). Stocks are also less valuable when the discount rate is higher; we will return to this point when we talk about the crisis. We can rewrite the DDM formula to have the ratio of the price to the dividend on the left:
P/D = 1/(k-g)
At the beginning of 2020, the Price/Dividend ratio of the S&P 500 was around 50. People sometimes refer to this number the other way around: they say that the dividend yield, which is the ratio of the dividend to the price, is equal to 1/50 = 2%.
Did a P/D ratio of 50 make sense before Covid-19? To answer this question, we need to give reasonable values to k and g.
Let's start with k. The discount rate is the expected return that makes investors willing to buy stocks. It has two components: the risk-free rate and the equity risk premium. The risk-free rate is the interest rate on government bonds: about 2% per year in the US. The equity risk premium is the additional compensation investors require to hold risky stocks: let's say 4% per year. So, k=6%.
Next, g. Let's assume a growth rate of dividends similar to that of nominal GDP: about 4% per year in the US. So, g=4%.
Putting things together: P/D = 1/(0.06-0.04) = 50
Conclusion: a P/D ratio of 50 before Covid-19 was not unreasonable. Of course, we can argue that a 4% growth rate is too optimistic or that a 4% equity risk premium is too low. But the bottom line is that we can reasonably explain the level of stock prices before the crisis. This will be useful to answer our follow-up question in the next post: Can we explain why stock prices dropped by 30% in the Covid crisis or whether the market over-reacted?
Previous post: Why is the price of oil futures negative at short maturities? »
Next post: Did the stock market over-react to Covid-19? »
Home »